Pipeline Trace Diagram
A pipeline read into a trace - a timespan for the pipeline, every matrix, downstream pipeline and job - is written as OpenTelemetry’s OTLP/JSON, which trace viewers read, or drawn as a Gantt chart.
Reading a Pipeline
PipelineReader reads a pipeline through the GitLab REST API, using the standard
library only:
from os import getenv
from pathlib import Path
from pyTooling.GitLab.Tracing import PipelineReader

reader = PipelineReader("gitlab-org/gitlab-development-kit", token=getenv("GITLAB_TOKEN"))
trace = reader.ReadPipeline(2954836704)      # optionally: downstream=False
trace.WriteJSONFile(Path("report/Pipeline.otlp.json"))
The project is given by its path or its numeric identifier. A public project’s pipelines are read without a token; a
private project’s need one with the read_api scope. A self-managed GitLab instance is reached with
apiURL="https://gitlab.example.com/api/v4".
The reader reads the pipeline, its jobs, its trigger jobs and - unless downstream=False - the child pipelines
those started, with their own child pipelines. A multi-project pipeline belongs to another project, so it is a
timespan of its trigger job without contents. ReadPayloads() returns
the payloads instead of the trace, in the shape Pipeline.Parse takes them,
e.g. to store them for later.
A request failing transiently - HTTP 429, 500, 502, 503 or 504, a timeout, or an unreachable API - is tried again,
retries times (default: 3), after a pause of retryDelay seconds (default: 2), which doubles with every attempt
or lasts as long as a Retry-After header demands, up to a minute. HTTP 401, 403 and 404 fail at once. GitLab
answers a list - the jobs, the trigger jobs - as a JSON array, which
ProjectClient reads page by page.
PipelineTrace.Parse does the conversion alone, for payloads
that were fetched another way. It is a class method, so converting needs no reader and therefore no token. It reads
the payloads into a Pipeline - see Pipeline Run - and hands that to
FromPipeline(), which is the entry point when the model was built
elsewhere. Reading the payloads is therefore the model’s job, and a field GitLab doesn’t document raises
GitLabError - as does an answer the reader itself can’t read, so everything GitLab says that
can’t be made sense of is one exception type. A request that fails is a RESTError, because
nothing about GitLab’s answer was wrong - there wasn’t one.
Timespans and Attributes
The pipeline becomes the trace, and every timespan below it is marked by Kind
with a member of SpanKind. Each kind is a class of its own - a
JobSpan sets ci.span.kind to job because that is what it is, and takes the
attributes of a job as parameters - so a reader states values and never a key, and the readers of GitLab and GitHub
build the same classes:
Kind |
Timespan |
|---|---|
|
The pipeline, from its start to its end. |
|
A downstream pipeline: the jobs of a child pipeline are grouped below a timespan named like the trigger job. |
|
A matrix: the jobs named |
|
|
|
A job, from its start to its completion. |
Every timespan also carries the attributes of OpenTelemetry’s semantic conventions for CI/CD, which
OTLP names as a namespace nested the way the keys are. The values a result may take are
Result, which are those of the model’s Outcome, so a result is
the element’s outcome. What only GitLab reports is named the same way by GitLab,
e.g. gitlab.status beside the result it was mapped to, a job’s gitlab.job.stage, and the
gitlab.runner.tags it requested its runner by. A matrix instance lists the values it was produced for in
gitlab.matrix.dimensions. A downstream pipeline carries its own identifier, URL and result as the task’s, and its
trigger job’s in gitlab.trigger.*.
A task is named the way GitLab’s tree reads - components / component:redis:test - while the timespan itself is
named by the part the model holds, so a timespan reads in the context its parents already give.
What differs from a GitHub Actions run, follows from what GitLab reports:
A job’s waiting timespan is the time GitLab reports it was queued, right in front of its start. GitLab creates every job of a pipeline with the pipeline, so the time between a job’s creation and its start is mostly the time it waited for the jobs it depends on - which isn’t waiting for a runner.
A job has no steps, so a job’s timespan has no sub-spans.
A job that hasn’t started - e.g. one waiting to be started by hand - has no timespan, and neither has a matrix holding only such jobs. A skipped job lasts no time, placed at the moment it was skipped.
A group - a matrix, a downstream pipeline, the trace itself - begins when it or the first job below it started, or earlier, when a job was queued for a runner before. GitLab reports the time in milliseconds and the queued time as a duration, so a waiting timespan reaching before its parent is cut at the parent’s begin.
A downstream pipeline reports its own times. One whose payloads weren’t read - a multi-project pipeline - has no start, and spans its creation to its completion; one a trigger job hasn’t started yet has no timespan.
Gantt Chart
pyTooling lays a trace out as a Gantt chart and draws it with matplotlib - see
pyTooling’s rendering. ciSpanFilter()
selects what a pipeline’s chart shows, and runnerCategory() colors a job by its
runner:
from pyTooling.GitLab.Tracing            import runnerCategory
from pyTooling.Tracing.Render            import GanttLayout, ciSpanFilter
from pyTooling.Tracing.Render.Matplotlib import MatplotlibRenderer

layout = GanttLayout(trace, spanFilter=ciSpanFilter(), categorize=runnerCategory)
MatplotlibRenderer(layout).Write(Path("report/Pipeline.svg"))
A row per job, below the rows of the matrix and the downstream pipeline it belongs to. The time a job was queued is drawn in light gray in front of the time it ran, colored per runner: its first tag, e.g.
saas-linux-large-amd64, or the runner’s description for a job without tags.The legend carries the statistics per runner: the number of jobs, and the shortest, average and longest waiting and running times.
Skipped jobs are left out, unless
excludeSkippedJobs=False.MatplotlibRenderer(layout, collapsible=True)writes an SVG file whose rows of downstream pipelines and matrices can be collapsed and expanded with a click.
The drawing needs the extra diagram (see Gantt Charts (Optional)).
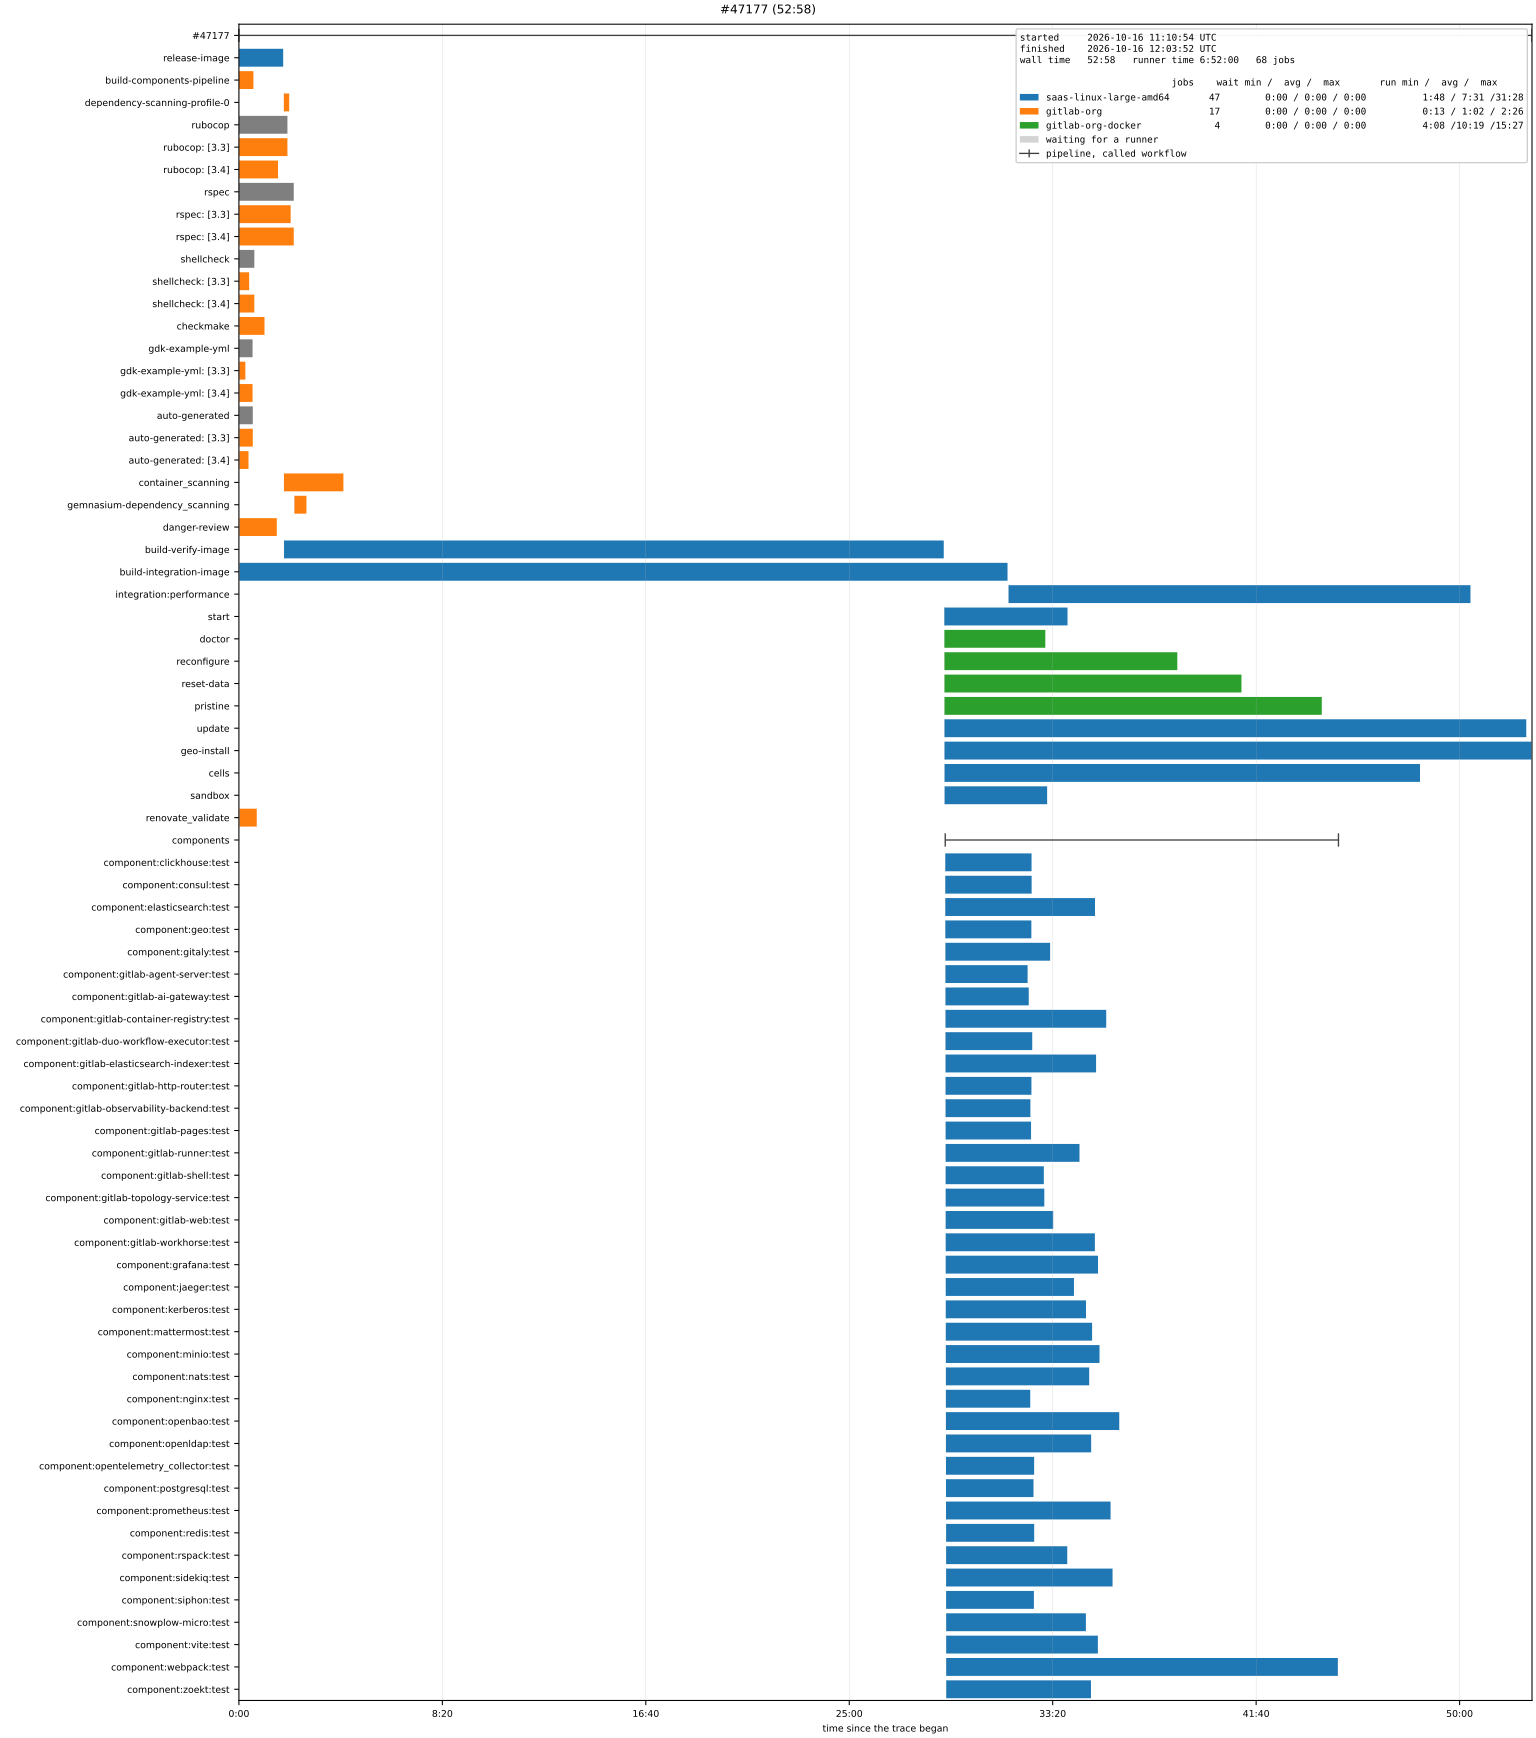
A merge request pipeline of the GitLab Development Kit
(pipeline 2954836704), drawn as
above from the recorded payloads in tests/data/Runs/GitLabDevelopmentKit.json.