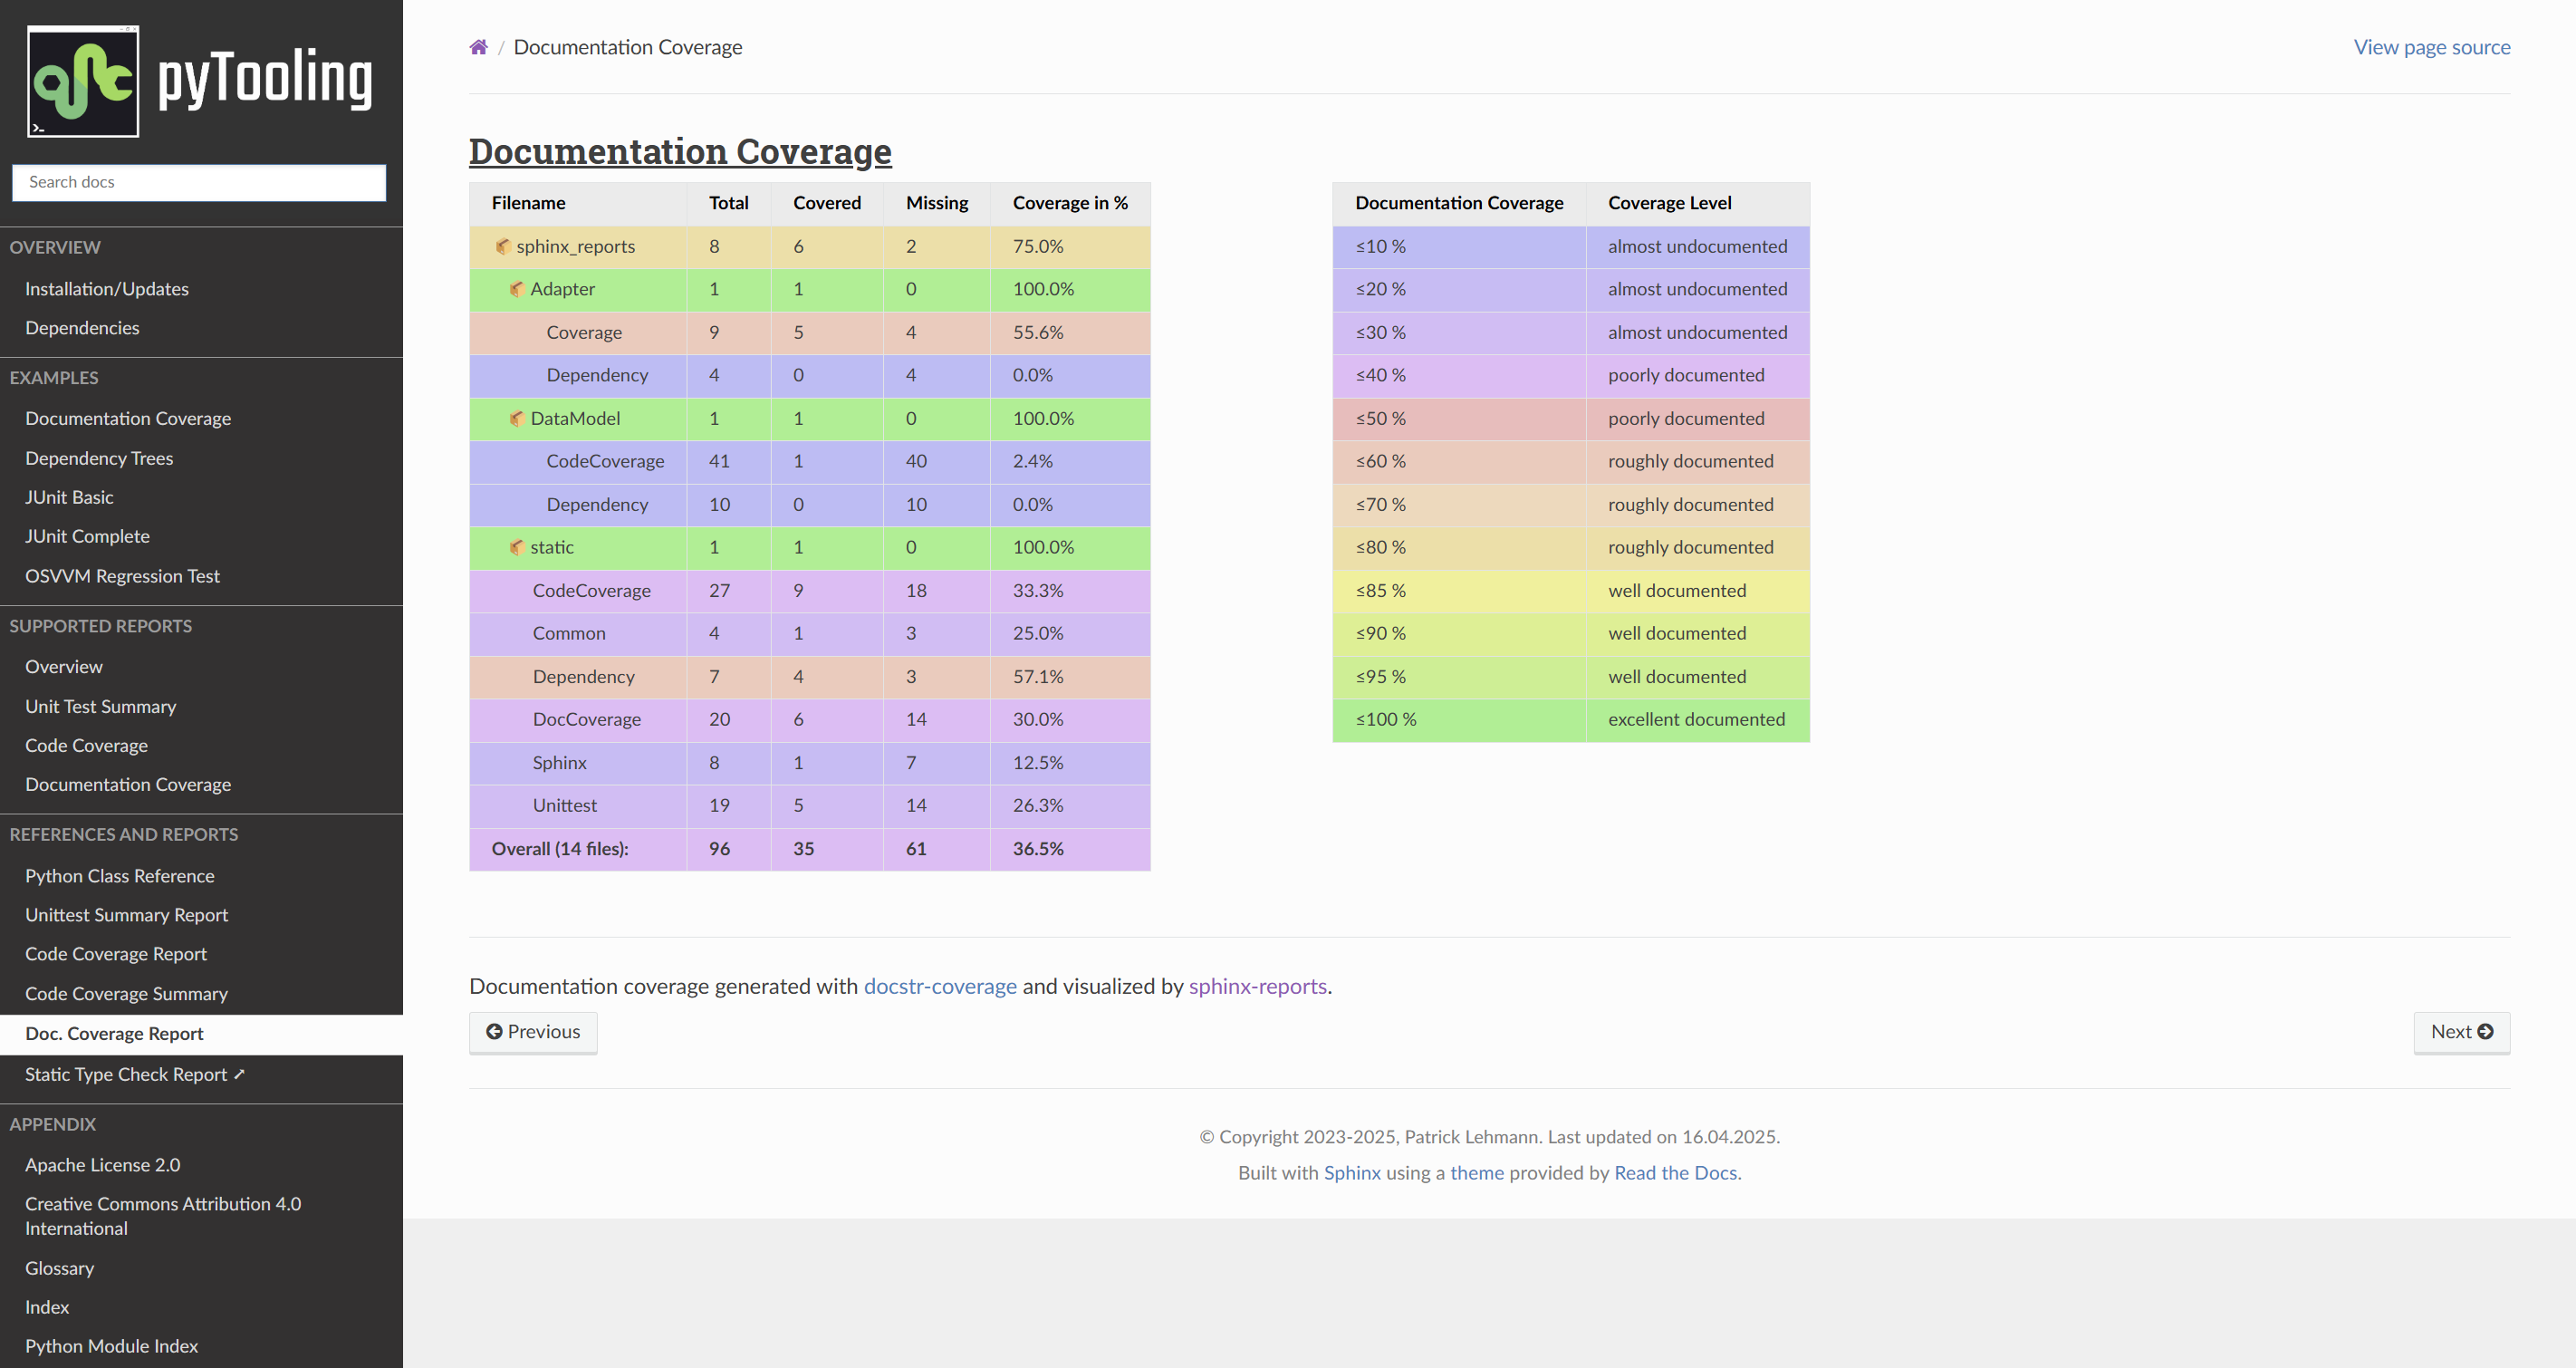
Documentation Coverage
The report:doc-coverage directive generates a documentation coverage report summary table. The
documentation coverage reports need to be configured in Sphinx’s conf.py for pre-analysis and data aggregation
(see below for details). This also allows the directive to supports multiple documentation
coverage reports per Sphinx documentation. Each documentation coverage report is referenced by the
reportid option, which matches the dictionary key used in the
configuration file.
Minimal Example
DocCoverage.rst
.. report:doc-coverage::
   :reportid: src
Options
Additional options are offered for fine-tuning and styling of the report:
reportidReference the documentation coverage report file and settings as listed in
conf.py.class(optional)User-defined CSS class name(s), which are applied on the HTML table.
Supported Documentation Coverage Formats
Currently, the documentation coverage is collected and measured by “””docstr_coverage”””.
Future Ideas
It’s planned to check if interrogate could be supported too.
It’s planned to display a per package and per module documentation coverage on a separate Sphinx document (separate HTML page) with syntax highlighting and colored background visualizing the coverage status.
Configuration Entries in conf.py
See the overview page on how to setup and enable the sphinx-reports extension in general.
Configure one or more coverage analysis reports in conf.py by adding a new section defining some
configuration variables. Each analysis report is identified by an ID, which is later referred to by the report
directive or legend directive. Here, the ID is called src (dictionary key). Each analysis report needs 4
configuration entries:
nameName of the Python package [1].
directoryThe directory of the package to analyze.
fail_belowAn integer value in range 0..100, for when a documentation coverage is considered FAILED.
levelsEither a predefined color palett name (like
"default"), or
a dictionary of coverage limits, their description and CSS style classes.
# ==============================================================================
# Sphinx-reports - DocCov
# ==============================================================================
report_doccov_packages = {
   "src": {
      "name":       "myPackage",
      "directory":  "../myPackage",
      "fail_below": 80,
      "levels":     "default"
   }
}
# ==============================================================================
# Sphinx-reports - DocCov
# ==============================================================================
report_doccov_packages = {
   "src": {
      "name":       "myPackage",
      "directory":  "../myPackage",
      "fail_below": 80,
      "levels": {
         30:      {"class": "report-cov-below30",  "desc": "almost undocumented"},
         50:      {"class": "report-cov-below50",  "desc": "poorly documented"},
         80:      {"class": "report-cov-below80",  "desc": "roughly documented"},
         90:      {"class": "report-cov-below90",  "desc": "well documented"},
         100:     {"class": "report-cov-below100", "desc": "excellent documented"},
         "error": {"class": "report-cov-error",    "desc": "internal error"},
      }
   }
}
Example Document
The following DocCoverage.rst document is an example on how to use the report:doc-coverage
directive. The first file consists of three parts:
A page title (headline)
A grid from sphinx{design} so
report:doc-coverageandreport:doc-coverage-legendcan be displayed side-by-sideA footer
The second file shows how to integrate that document into the navigation bar / toc-tree.
DocCoverage.rst
.. _DOCCOVER:

Documentation Coverage Report
#############################

.. grid:: 2

   .. grid-item::
      :columns: 5

      .. report:doc-coverage::
         :reportid: src

   .. grid-item::
      :columns: 7

      .. report:doc-coverage-legend::
         :reportid: src
         :style: vertical-table

----------

Documentation coverage generated with `"""docstr-coverage""" <https://github.com/HunterMcGushion/docstr_coverage>`__
and visualized by `sphinx-reports <https://github.com/pyTooling/sphinx-reports>`__.
index.rst
.. toctree::
   :caption: References and Reports
   :hidden:

   Python Class Reference <sphinx_reports/sphinx_reports>
   Unittest
   CodeCoverage
   Doc. Coverage Report <DocCoverage>
   Static Type Check Report ➚ <typing/index>

.. toctree::
   :caption: Appendix
   :hidden:
Sphinx Directives
The following directives are provided for visualizing documentation coverage reports.
- .. report:doc-coverage::
Generate a table summarizing the documentation coverage per Python source code file (packages and/or modules). The package hierarchy is visualized by indentation and a 📦 symbol.
- :class:
Optional: A list of space separated user-defined CSS class names.
The CSS classes are applied on the HTML
<table>tag.
- :reportid:
An identifier referencing a dictionary entry (key) in the configuration variable
report_doccov_packagesdefined inconf.py.
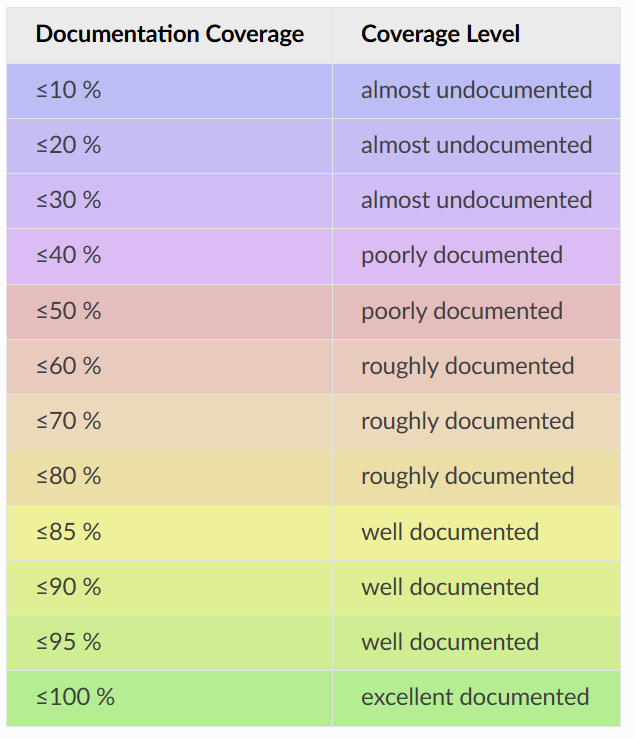
- .. report:doc-coverage-legend::
Generate a table showing the color palett applied to a documentation coverage summary table.
Each documentation coverage report could potentially use its own color palett. Therefore, the
reportidoptions should use the same values.- :class:
Optional: A list of space separated user-defined CSS class names.
The CSS classes are applied on the HTML
<table>tag.
- :style:
Specifies the legend style. Default is
horizontal-table.Possible values:
defaulthorizontal-tablevertical-table
Sphinx Roles
There are no roles defined.
Color Paletts
The default color palett can be changed by:
setting a different predefined color palett name.
specifying a new list of coverage level which also define a corresponding CSS class name.
overriding the existing CSS rules with different colors and styles.
default palett
The default palett defines 12 levels: ≤10%, ≤20%, ≤30%, ≤40%, ≤50%, ≤60%, ≤70%, ≤80%, ≤85%, ≤90%, ≤95%, ≤100%
from blue via red, orange, yellow to green.
Custom CSS Styling
Table Styling
The table-tag has 2 additional CSS classes:
report-doccov-tableAllows selecting the
tabletag, but only for documentation coverage reports.report-doccov-%reportid%Allows selecting one specific documentation coverage report.
%reportid%gets replaced by the reportid used in the option field of the directive. Here it got replaced bysrc.
Row Styling
The tr-tag (table row) has 2 additional CSS classes:
report-package/report-module/report-summaryThis class indicated if the row refers to a Python package, Python module or the overall coverage summary (last row).
report-below-%percentage%Depending on the coverage in percent, a CSS class is added according to the color palett configuration.
<table class="report-doccov-table report-doccov-src">
  <thead>
    <tr>
      <th> ..... </th>
      .....
      <th> ..... </th>
    </tr>
  </thead>
  <tbody>
    <tr class="report-package report-below-30"> ..... </tr>
    <tr class="report-module report-below-70"> ..... </tr>
    .....
    <tr class="report-summary report-below-50"> ..... </tr>
  </tbody>
</table>
table.report-doccov-table > thead > tr,
table.report-doccov-legend > thead > tr {
   background: #ebebeb;
}

table.report-doccov-table > tbody > tr.report-cov-below95,
table.report-doccov-legend > tbody > tr.report-cov-below95 {
   background: hsl(90 75% 75%);
}

table.report-doccov-table > tbody > tr.report-summary {
   font-weight: bold;
}
Footnotes